
July 2025 Calgary & Area Real Estate Market Summary
July 2025 Calgary Real Estate Market Summary – City, Districts & Property Types
Source: CREB Calgary Monthly Statistics Package (PDF)
City of Calgary
| Metric | Value |
|---|---|
| Sales | 2,099 |
| New Listings | 3,911 |
| Sales to New Listings Ratio | 54% |
| Inventory | 6,917 |
| Months of Supply | 3.30 |
| Benchmark Price | $582,900 |
| Average Price | $616,686 |
| Median Price | $569,500 |
In July 2025, Calgary saw 2,099 residential sales, a 12% decline from July 2024. Inventory climbed to 6,917 units, marking the highest July supply since pre-pandemic levels. Increased listings, particularly in newer communities, expanded choice but eased price momentum. The citywide benchmark price settled at $582,900 (–4% Y/Y), reflecting supply-side pressures on apartments and row homes, while detached and semi-detached prices remained relatively stable.
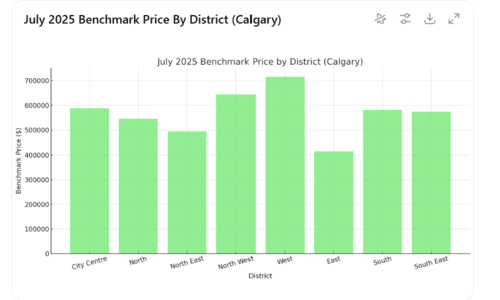
Benchmark Prices by District
| District | Benchmark Price |
|---|---|
| City Centre | $588,000 |
| North | $545,700 |
| North East | $494,400 |
| North West | $643,400 |
| West | $716,000 |
| East | $414,600 |
| South | $581,100 |
| South East | $573,300 |
District-level price trends varied across Calgary. The West ($716,000) and North West ($643,400) districts posted the highest benchmarks, while East Calgary remained the most affordable at $414,600. Most districts held steady or posted modest gains, but areas like the North East and East saw benchmark declines of up to 5% Y/Y, largely due to supply influx.
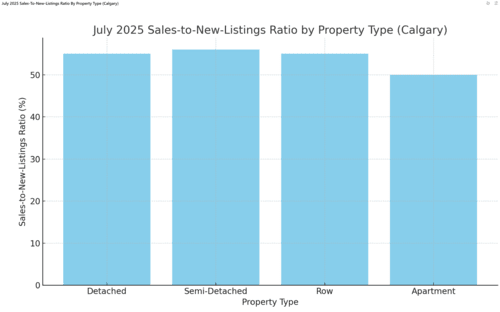
Market by Property Type
| Property Type | Sales | New Listings | Ratio | Inventory | Months Supply | Benchmark Price |
|---|---|---|---|---|---|---|
| Detached | 1,031 | 1,888 | 55% | 3,078 | 2.99 | $761,800 |
| Semi-Detached | 187 | 331 | 56% | 549 | 2.94 | $697,500 |
| Row | 373 | 678 | 55% | 1,193 | 3.20 | $446,200 |
| Apartment | 508 | 1,014 | 50% | 2,097 | 4.13 | $329,600 |
Detached: With months of supply at 3, detached homes remained in a balanced market. Benchmark prices dipped slightly to $761,800 (–1% Y/Y).
Semi-Detached: Semi-detached homes stayed stable with a benchmark price of $697,500 (+1% Y/Y), backed by low inventory in key districts.
Row Homes: Increased supply (3.2 months) pushed row home prices down to $446,200 (–4% Y/Y), especially in North East and North districts.
Apartments: Rising competition from new builds and elevated inventory (4.13 months supply) brought apartment benchmarks down to $329,600 (–5% Y/Y).
© 2025 Diane Richardson. All information herein deemed reliable but not guaranteed.

Comments:
Post Your Comment: