
July 2025 Calgary Real Estate Market Summary – City, Towns & Counties
Source: CREB Regional Monthly Stats Package (PDF)
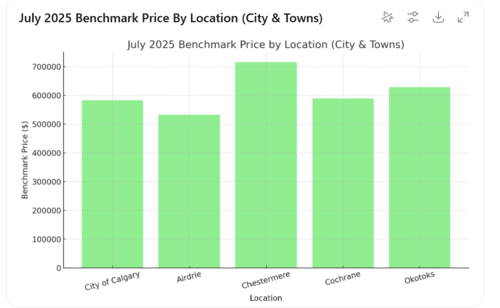
City of Calgary
| Metric | Value |
|---|---|
| Sales | 2,099 |
| New Listings | 3,911 |
| Sales to New Listings Ratio | 54% |
| Inventory | 6,917 |
| Months of Supply | 3.30 |
| Benchmark Price | $582,900 |
| Average Price | $616,686 |
| Median Price | $569,500 |
In July 2025, Calgary recorded 2,099 home sales, down 14% year-over-year but still above pre-2021 levels. Improved new listings lifted inventory to 6,917 units, keeping months of supply at 3.3. This increased selection placed modest downward pressure on prices, with the benchmark price settling at $582,900 (–3% Y/Y). Detached home prices remain resilient, while apartment and row house prices softened slightly.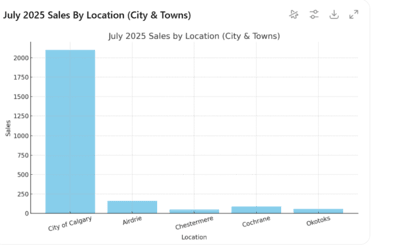
Towns
| Town | Sales | New Listings | Ratio | Inventory | Months Supply | Benchmark Price |
|---|---|---|---|---|---|---|
| Airdrie | 160 | 306 | 52% | 543 | 3.39 | $532,800 |
| Chestermere | 48 | 143 | 34% | 282 | 5.88 | $715,600 |
| Cochrane | 91 | N/A | N/A | 302 | 3.32 | $590,000 |
| Okotoks | 57 | N/A | 71% | 125 | 2.19 | $628,500 |
Airdrie: Sales dipped 14% Y/Y to 160, while inventory rose to 543 units (3.39 months supply), moderating prices to $532,800 (–4% Y/Y).
Chestermere: 48 sales (–8% Y/Y) and 282 active listings pushed supply to nearly 6 months, but benchmark prices stayed robust at $715,600 (+0.5% Y/Y).
Cochrane: Despite an uptick in new listings, sales held steady at 91. Inventory climbed to 302 units (3.32 months supply), with benchmark prices up 2.3% Y/Y to $590,000.
Okotoks: A tight 2.19 months of supply with only 125 active listings sustained upward price pressure, with benchmarks rising 1% Y/Y to $628,500.
Counties & Regions
| Region | Sales | New Listings | Ratio | Inventory | Months Supply | Benchmark Price |
|---|---|---|---|---|---|---|
| Rocky View | 161 | 277 | 58% | 612 | 3.80 | $655,700 |
| Foothills | 125 | 168 | 74% | 305 | 2.44 | $652,800 |
| Mountain View | 67 | 97 | 69% | 178 | 2.66 | $515,600 |
| Kneehill | 12 | 14 | 86% | 37 | 3.08 | $270,200 |
| Wheatland | 46 | 59 | 78% | 144 | 3.13 | $458,500 |
| Willow Creek | 28 | 39 | 72% | 57 | 2.04 | $348,200 |
| Vulcan | 10 | 17 | 59% | 47 | 4.70 | $350,600 |
| Bighorn | 44 | 79 | 56% | 171 | 3.89 | $1,100,600 |
Rocky View: Inventory expanded to 612 units, with a balanced 58% ratio keeping benchmark prices firm at $655,700 (+2.1% Y/Y).
Foothills: Strong demand persists with a 74% ratio and 2.44 months supply, lifting benchmark prices to $652,800 (+2.5% Y/Y).
Mountain View: Market remains balanced at 2.66 months supply, with benchmark prices holding at $515,600 (flat Y/Y).
Kneehill: Sales-to-listings ratio of 86% reflects tight conditions, stabilizing prices at $270,200.
Wheatland: 78% ratio and 3.13 months supply maintain prices around $458,500.
Willow Creek: Low 2.04 months supply supports a benchmark of $348,200 (+1.2% Y/Y).
Vulcan: Inventory buildup (4.70 months supply) is keeping prices steady at $350,600.
Bighorn: High-value properties persist with a benchmark of $1,100,600 (+2.5% Y/Y).
© 2025 Diane Richardson. All information herein deemed reliable but not guaranteed.

Comments:
Post Your Comment: